G.S. Sureshchandar, Chandrasekharan Rajendran, R.N. Anantharaman
| The Authors |
G.S. Sureshchandar, Industrial Engineering and Management Division, Department of Humanities and Social Sciences, Indian Institute of Technology Madras, Chennai, India
Chandrasekharan Rajendran, Industrial Engineering and Management Division, Department of Humanities and Social Sciences, Indian Institute of Technology Madras, Chennai, India
R.N. Anantharaman, Industrial Engineering and Management Division, Department of Humanities and Social Sciences, Indian Institute of Technology Madras, Chennai, India
| Acknowledgements |
The authors thank the three anonymous referees for their constructive comments and suggestions in improving the earlier version of the paper.
| Abstract |
The research literature on service quality has indeed swelled enormously over the past few years with numerous researchers administering various models across the world. Nevertheless, the SERVQUAL instrument forms the basis on which all other works have been actualized. Interestingly, the conceptualization, measurement and applications of SERVQUAL across different industrial and commercial settings are not bereft of controversies either. A careful examination of the instrument divulges that the factors and the corresponding items are not comprehensive as it appears that the instrument has left out certain important constituents of service quality. In this background, the current research work strives to bring to light some of the critical determinants of service quality that have been overlooked in the literature and proposes a comprehensive model and an instrument framework for measuring customer perceived service quality. The instrument has been designed with specific reference to the banking sector. Data have been collected from customers of banks in a huge developing economy. The proposed instrument has been empirically tested for unidimensionality, reliability and construct validity using a confirmatory factor analysis approach. The present study offers a systematic procedure that could form the cornerstone for providing further insights on the conceptual and empirical comprehension of customer perceived service quality and its constituents.
Article type: Theoretical with worked example.
Keywords: Service quality, Customer behaviour, Factor analysis.
Content Indicators: Research Implications** Practice Implications** Originality** Readability**
Journal of Services Marketing
Volume 16 Number 1 2002 pp.
9-34
Copyright © MCB University Press ISSN 0887-6045
Relationship to costs
Of late, service quality has been receiving much prominence because of its obvious relationship to costs (Kellogg et al., 1997), financial performance (Nelson et al., 1992; Rust and Zahorik, 1993; Rust et al., 1994, 1995, 1999; Hallowell, 1996), customer satisfaction (Bolton and Drew, 1991a, b; Cronin and Taylor, 1992, 1994; Boulding et al., 1993; Kellogg et al., 1997; Stauss and Neuhaus, 1997; Roest and Pieters, 1997; Shemwell et al., 1998; Soderlund, 1998) and customer retention (Keaveny, 1995; Boshoff, 1997; Hocutt, 1998). Numerous organizations have started focussing on ascertaining the customer perceptions of service quality and subsequently devising strategies to deliver the same (Cronin and Taylor, 1992, 1994; Teas, 1993a, 1994; Zeithaml et al., 1996).
Headway on the research front
A lot of headway has been made on the research front in the last two decades. Rust and Oliver (1994) argued that researchers have made huge inroads on unraveling the concepts of service quality, customer satisfaction, and to a lesser extent, customer value. The authors concluded that it was indeed fascinating to note that the modern business people around the globe have started observing keenly what is transpiring on the boundaries of service quality research, the outcomes of which would help them to survive and excel in the global marketplace. Cronin and Taylor (1992), therefore, postulated that curiosity in the appraisal of service quality was discernibly high and the delivery of higher levels of service quality was the tactic that was predominantly employed by service providers effectively to carve a niche for themselves in the global market. It was also observed that the obstacles in the path of implementing such a strategy had been dealt with in detail by various researchers and that service quality is an abstruse and abstract construct that is arduous to define and measure.
Service firms find it difficult to envision and understand what aspects connote high quality to consumers, and the levels of those aspects that are required to deliver high quality service. Only when a service provider has a fairly definite knowledge on how the service would be perceived by the customer, would he/she be able to direct these assessments in the preferred direction. The significance of developing worthy associations with customers has been acknowledged by many firms. But what the firms lack is the competence to create and sustain such good relationships. Service quality is, by character, an abstruse concept, which means that ably managing service quality obligates a lucid discernment of what precisely service quality alludes to customers (Rust and Oliver, 1994). Rationally managing a service interaction also calls for comprehending the much complicated behaviours of employees that will have a telling effect on the customer perceptions of service quality. Such behaviours help the consumers to differentiate a gratifying service encounter from a dissatisfactory one. Firms need to train, motivate, and reward employees for demonstrating the desirable behaviours in service encounters (Bitner et al., 1990).
Research literature
The research literature on service quality and satisfaction has indeed swelled enormously over the past two decades (e.g. Parasuraman et al., 1985, 1988, 1991, 1993, 1994a, b; Zeithaml et al., 1985, 1990, 1993, 1996; Carman, 1990; Finn and Lamb, 1991; Cronin and Taylor, 1992, 1994; Babakus and Boller, 1992; Brown et al., 1993; Teas, 1993a, 1994). However, the SERVQUAL instrument of Parasuraman et al. (1988), a 22-item scale that measures service quality along five factors, forms the cornerstone on which all other works have been built.
But a careful examination of the scale items divulges that most of the items focus on the component of human interaction/intervention in the service delivery and the rest on the tangibles facet of the service (such as the effect of atmospherics, design and decor elements, appearance of equipment, employee dress, etc.). The point to be underscored here is that the SERVQUAL instrument does not address certain other important constituents of service quality such as the features associated with a service, namely, the service product or core service, systematization/standardization of service delivery in order to establish the seamlessness in service, and the image or goodwill a service firm could establish for itself in terms of being responsible to the society in which it operates.
In this background, the current research work aspires to develop an empirical model of service quality that could form the basis for a better understanding of the determinants of customer perceived service quality.
Therefore, the objectives of this paper are threefold:
Framework of service quality
Parasuraman et al. (1985) pointed out that many tangible cues such as style, hardness, colour, label, feel, package, fit, etc., were used by consumers to judge the quality of products, but while purchasing services, the tangible evidence was limited to the service provider's equipment, physical facility and personnel. In an extensive exploratory investigation of quality in four service businesses (namely, retail banking, credit card, securities brokerage, and product repair and maintenance), Parasuraman et al. (1985) developed a framework of service quality, and also proffered theories and recommendations to activate further research on the same. The authors (see Parasuraman et al., 1985, 1988; Zeithaml et al., 1985, 1990) made pioneering ventures to comprehend the construct of service quality and its determinants. They devised a model called "Gap analysis model" and defined service quality as the degree of discrepancy between customers' normative expectations for the service and their perceptions of service performance. They also unsheathed a comprehensive set of service attributes that customers might use as criteria in assessing service performance. Subsequent empirical work based on the exploratory research yielded SERVQUAL, a 22-item scale for measuring service quality along five dimensions: reliability, responsiveness, assurance, empathy, and tangibles (Parasuraman et al., 1988). SERVQUAL operationalizes service quality by subtracting customers' expectation scores from their perception scores with respect to the 22 items. While the original SERVQUAL instrument (Parasuraman et al., 1988) has been revised, refined and reformed, its primary content has remained unaltered (Parasuraman et al., 1991, 1994a, b).
Psychometric soundness
In another empirical work, the SERVQUAL's developers have presented illustration and supporting evidence to reaffirm the SERVQUAL instrument's psychometric soundness and practical value (Parasuraman et al., 1991). The SERVQUAL instrument's expectation statements refer to the service level that customers believe they "should" get from the service provider, i.e. the expectations component portrays the desired service construct (Parasuraman et al., 1994a). In yet another empirical work, Parasuraman et al. (1994b) revised SERVQUAL's structure to comprehend not only the discrepancy between perceived service and desired service (labeled as measure of service superiority or MSS), but also the distinction between perceived service and adequate service (labeled as measure of service adequacy or MSA).
Several works have dealt in detail with the theoretical underpinnings and practical applications of SERVQUAL in a variety of business settings. Interestingly, the conceptualization, measurement and applications of SERVQUAL across different industrial settings are not bereft of controversies either (see Buttle, 1996). The first among a long list of researchers to question and criticize the validity of SERVQUAL across different industrial settings was Carman (1990). The major concern raised by the author was on the psychometric soundness of the differences between expectations and perceptions. The author further recommended the collection of perceptions-expectations, i.e. (P-E) differences directly in a combined format. Some of the suspicions of Carman were further endorsed by Babakus and Boller (1992). In an empirical research in an electric and gas utility company, the authors found the content, convergent and discriminant validities for the different SERVQUAL factors, and suggested that the dimensionality may vary with the type of the service under study. In another empirical work, Cronin and Taylor (1992, 1994) criticized the conceptualization and measurement of service quality. The authors illustrated that SERVQUAL confounds customer satisfaction with service quality, and proposed a performance-based measure of service quality called SERVPERF by explaining that service quality is a form of customer attitude. Yet another major criticism was levied by Teas (1993a, 1994). In his work, the author examined conceptual and operational issues associated with "perceptions-minus-expectations (P-E)" service quality model, and developed alternative models of perceived service quality based on evaluated performance (EP) and normated quality (NQ). He concluded that the EP model could overcome some of the problems associated with the P-E gap conceptualization of service quality.
Two broad categories
Buttle (1996) summarized the major criticisms of SERVQUAL in two broad categories - theoretical and operational.
Theoretical criticisms include:
Operational issues comprise:
The concerns raised in the above-mentioned works clearly indicate that there is still scope for further research in the subject of service quality, which is, by nature, an abstract concept that is difficult to comprehend.
Widespread impact
Notwithstanding its widespread impact on business and academia, SERVQUAL has been subjected to number of criticisms as well. But what is to be reexamined is the verity that in spite of disagreement over use of both the expectations and performance measures and the dimensionality of the SERVQUAL instrument across different industrial settings, researchers and practitioners seem to generally agree that the 22 items are good predictors of overall evaluation of service quality by consumers. The point worth mentioning here is that the completeness of the 22-item scale proposed by Parasuraman et al. (1988) in addressing the critical dimensions of service quality is a subject of further investigation because a careful scrutiny of the scale items reveals that most of the items mainly focus on the human aspects of service delivery and the remaining on the tangibles of service (like the effect of atmospherics, design and decor elements, appearance of equipment, employee dress, etc.).
The importance of the element of human interaction/intervention in the service delivery has been recognized and reiterated by many other researchers as well (e.g. Mills and Morris, 1986; Norman, 1991; Harber et al., 1993a, b; Stebbing, 1993; Schneider and Bowen, 1992, 1993, 1995; Schneider et al., 1994, 1996). Of the five SERVQUAL's dimensions, four, namely, reliability, responsiveness, assurance and empathy, correspond to this factor of human element in the service delivery.
Tangibles
The fifth dimension, i.e. "tangibles", relates to the effect of physical facility, equipment, personnel and communication materials on customers. The effect of these atmospherics, popularly known as "servicescapes" (Bitner, 1992), does influence customers in numerous ways. Bitner (1992) explained how the employees and customers are influenced by these tangibles facets of services in physiological, psychological, sociological, cognitive, and emotional ways. Many other authors have also discussed in detail the impact of these servicescapes on the service perceptions by customers (e.g. Kotler, 1973; Shostack, 1977; Booms and Bitner, 1982; Rapoport, 1982; Upah and Fulton, 1985; Zeithaml et al., 1985; Bitner, 1986; Berry and Clark, 1986; Baker, 1987) and their effect on employees (e.g. Becker, 1981; Davis, 1984; Steele, 1986; Wineman, 1986; Baker et al., 1988; Sundsstrom and Altman, 1989).
Although the importance and relevance of these two factors in predicting service quality is, without an iota of doubt, acclaimed by one and all, it should also be emphasized that the highly subjective concept of service quality is not only confined to the realms of these two factors, but also includes other critical aspects such as the service product or the core service; systematization/standardization of service delivery (the non-human element); and the social responsibility of the service organization.
Essence of a service
The core service refers to the essence of a service. Whatever service features are offered is as important as how it is delivered (Rust and Oliver, 1994). Schneider and Bowen (1995) explained that in a service business a lot of emphasis is usually placed on the procedures, processes, and contexts for service to the extent the organization tends to overlook that there is also something called the "core service". The authors also reasoned that fancy facilities, modern equipment, stylish uniforms, and terrific signs can never make up for bad/mediocre food, poor financial advice, an inappropriate will, or a lousy music.
For instance, the various varieties of food and other dishes a restaurant offers to its customers constitute a service product. Even though the restaurant's personnel are very friendly, pleasant and gentle to their customers, if the restaurant fails to offer a good quality and tasty food or a wide variety of recipes, customers may not attach a very high value to the quality of service it offers. Even if a lawyer is very considerate and kind to his/her clients, the clients may not perceive his/her service quality as high, if the lawyer lacks competence in making use of the key/subtle points in the law to the clients' advantage. Although an educational institution has good infrastructure and other supporting facilities, it will not get a high rating in the academic world if it lacks well qualified and knowledgeable teachers who can impart quality education to their students.
Quality features
Schneider and Bowen (1995) summarized that the core service itself has perceivable, tangible, and multidimensional quality features that could distinguish services, and could predominate over other issues such as delivery and the like. The nature and quality of this core service largely influences the quality perceptions of the customers.
Systematization of service delivery refers to the non-human element in the service delivery in contrast to the human element, which has been effectively captured by SERVQUAL. Service delivery processes should be perfectly standardized, streamlined, and simplified so that customers can receive the service without any hassles, hiccups or undesired /inordinate questioning by the service providers. A study of 1,500 consumers by Cambridge Reports, a Massachusetts-based research firm, found that 44 percent of the respondents indicated that "ease of doing business with" was the fundamental reason for choosing a financial firm (Zemke and Schaaf, 1990).
The effectiveness of the total quality service (TQS) movement relies on understanding and utilizing the process as a tool to respond to customers faster than the competitors (Milakovich, 1995). Ahire et al. (1995) reasoned that the overall quality of the products or services could be made better by improving the quality of the processes either directly or indirectly. Enhancement of technological capability (e.g. computerization, networking of operations, etc.) plays a crucial role in establishing the seamlessness in service delivery.
Social responsibility is an important concept, which is probably missed out completely in the quality management literature, though it has repeatedly found due recognition and representation in the Malcolm Baldrige Model (US Department of Commerce and Technology Administration, 1997, 1998, 1999, 2000). A study conducted by "Consumer Reports" on customers of non-banking financials (Zemke and Schaaf, 1990) found that one of the predominant consumer concerns on service quality was: "Equal treatment tempered by pragmatism, stemming from the belief that everyone, big or small, should be treated the same". They were also concerned about getting good service at a reasonable price, but not at the expense of quality. With the entire business community undergoing a service quality revolution this subtle aspect helps an organization to lead as a corporate citizen in encouraging ethical behaviour in everything it does. For instance, a hospital that gives free treatment to the economically downtrodden, an educational institution that grants scholarships for the poor, or a financial institution that provides loans to needy ones with less rigid loan conditions, would certainly be revered and valued by the customers. Although this factor sounds highly complex and imperceptible, it improves an organization's image and goodwill thereby influencing customer perceptions of service quality.
Five factors
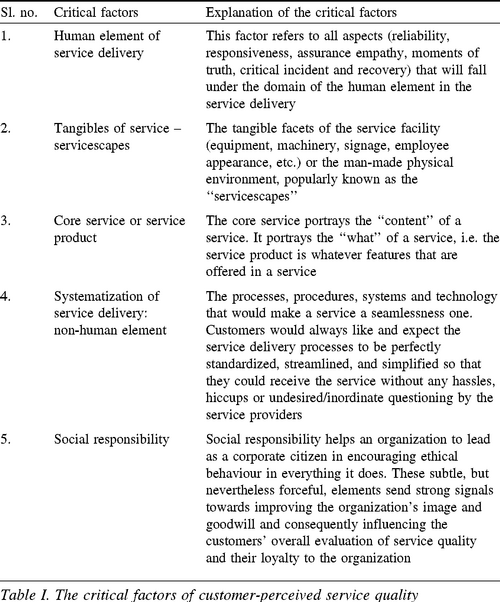
To put everything in a nutshell, customer perceived service quality is based on essentially five factors (see Figure 1), namely:
The five factors of customer perceived service quality along with their meanings are summarized in Table I.
Survey instrument
In order to validate empirically the identified factors of service quality a survey instrument consisting of 41 items has been developed in the present study. The instrument has been developed based on a thorough review of literature. The developed instrument has been fine-tuned based on the comments and suggestions from 20 experts (academicians, researchers and practitioners) so as to effectively address all the aspects of customer-perceived service quality. The instrument has been developed with specific reference to the banking industry. The items under the dimensions "human element of service delivery" and "servicescapes" are primarily based on the SERVQUAL instrument, i.e. five items have been retained as they are and 14 items have been slightly modified/merged together and subsequently reduced to ten items as opined by experts in this field during the content validity checking. Items have been modified largely because in those cases it is felt that a reformed statement might represent a better and distinct measure of the aspect intended to be measured. Eight items are also supplemented so as to effectively and realistically address all the facets of these two dimensions (i.e. human element of service delivery and servicescapes). Two items, i.e. maintaining error-free records and modern equipment, have been deleted from SERVQUAL as it is felt that the first one is irrelevant in this era of computerization, and the second one is too generic and has been taken care of in other items under the dimension "servicescapes".
Modified items
One item, i.e. "Convenient business hours" has been modified and put under the dimension "Core service". The items that are modified, added, retained and deleted are given in Table II, Table III, Table IVand Table V. For the other three dimensions (i.e. core service, systematization of service delivery and social responsibility) items are framed suitably in order to measure the same. The items that are classified under these dimensions are as follows:
The details of the instrument with five factors and the corresponding items are presented in the Appendix. The items with respect to the various factors have been jumbled and arranged in a random order.
The items are highly flexible
The factors and the items (vis-à-vis the parlance) are highly flexible, in the sense the items (phraseology) can be modified to suit any category in the service industry. But due to practical difficulties and other constraints, the current study has been confined to the banking sector only. One particular sector out of the wide ambit of organizations in the service industry is chosen in order to have a high level of internal validity. The banking sector has been chosen because perceived service quality tends to play a significant role in high contact (i.e. high interaction between the customers and the service providers) industries such as banks (see Angur et al., 1999). Also, banks traditionally have long-term business relationships with customers. Moreover, the banking sector is large enough to capture and represent all the critical features of service quality (though the intensity of these factors may vary from one service organization to another) that the customers might use as indicators in evaluating the quality of service delivered. Therefore, by targeting at the banking sector and making use of this study as a reference, the results and findings will also have a much wider appeal, i.e. extendible to other service organizations as well.
Data have been collected from customers of different banks in India. The sampling procedure used for the study was stratified random sampling. The stratification has been done based on the type of bank (e.g. public sector, private sector, and foreign bank). From each group of bank around 150 customers have been randomly selected. Data have been collected using the "personal-contact" approach, i.e. the respondents have been approached personally and the survey explained in detail (including its purpose, the meaning of the items and what is expected of the respondents). Questionnaires have been distributed to the customers and they have been asked to give their perception of the level of service quality delivered by the banks on a seven-point Likert scale (ranging from 1, indicating very poor to 7, indicating very good). The respondents have been asked to contact the researchers whenever they encounter any difficulty in responding to the questionnaire. A total of 452 customers from 51 different banks have been approached from whom 277 correctly completed questionnaires from 43 banks have been obtained, yielding a response rate of about 60 percent. Table VI shows the number of banks in each sector and the corresponding number of respondents (customers) who have participated in the study. The high response rate is due to the personal-contact approach used followed by periodic follow-ups over telephone and personal visits.
Valid and reliable estimates
A critical aspect in the evolution of a fundamental theory in any management concept is the development of good measures to obtain valid and reliable estimates of the constructs of interest. Without establishing the reliability and validity, it is difficult to standardize the measurement scales, and hard to know whether they truly measure what they intend to measure. The various steps involved in the development and validation of the measurement scale are shown by means of flow chart in Figure 2.
Conventionally, exploratory factor analysis (EFA) is used for the situation where the relationships between the observed and latent (factors) variables are unknown or uncertain. The approach proceeds in an exploratory manner to unearth the underlying factors, thereby illustrating the relationships between the latent factors and the observed variables. The purpose is to come out with the minimum number of factors that will explain the covariation among the observed variables. Nonetheless, this approach suffers from certain limitations. The primary limitation of the this approach is that in EFA, it is assumed that the correlations between the variables are due to one or several underlying hidden factors that generate the raw data. But, the researcher may have only an imprecise but not an explicit idea about these correlations or factors. Moreover, even if he/she is fairly sure about the presence of a particular factor, he/she may not know which variable influences the factor (Byrne, 1994). Therefore, the investigator may lack any sound evidence on which to make his/her interpretations. Furthermore, items are assigned to those factors on which they load to a significant extent. Therefore, it is possible for an item to load substantially on more than one factor and hence the distinctiveness of the factors is affected. Besides, in pure EFA, items are loaded only on a statistical basis and not any theoretical justification, thereby affecting the valid identity of the factors. And, at last the concept of unidimensionality (i.e. extent to which items on a factor measure one single construct) has not been taken care of in EFA approach (Ahire et al., 1996). Essentially, EFA is particularly useful only in the absence of a sufficiently detailed theory about the relationships of the observed variables to the latent constructs (i.e. only for constructs that are at a very nascent stage of research).
The CFA approach
On the contrary, the CFA approach, to a very great extent, overcomes the above mentioned limitations and addresses the situation wherein the researcher specifies a model a priori, and tests the conjecture that a relationship between the observed and the latent variables does in fact exist. In short, the hypotheses that form the constraints are an integral part of the CFA technique. This is due to the fact that the researcher has a reasonably good knowledge of the number of factors that are required to explain the intercorrelations among the measured variables. In addition, he/she knows which factors account for the covariation among the observed variables. The proposed model is built on logic and other research and theoretical findings, and if the researcher has a reasonably good idea about the observed variables that are likely to be the reliable indicators of a particular factor, CFA is more appropriate than EFA (Bentler, 1995). Given the fact that service quality is at an advanced stage of research and in view of the increasing acceptance of the CFA approach over the conventional EFA in both marketing and organizational behaviour literatures, the present work chose to adopt the factor analysis (for scale refinement and validation) in a confirmatory fashion.
Mandatory condition
A highly mandatory condition for construct validity and reliability checking is the unidimensionality of the measure (Anderson and Gerbing, 1991). It refers to the existence of a single construct/trait underlying a set of measures. The usefulness of items within a measure depends on the extent to which they share a common core (Nunnally, 1988). The concept of unidimensionality enables us to represent the value of a scale by a solitary number (Venkatraman, 1989). In order to check for unidimensionality, a measurement model is specified for each construct and CFA is run for all the constructs. Individual items in the model are examined to see how closely they represent the same construct (Ahire et al., 1996). A comparative fit index (CFI) of 0.90 or above for the model implies that there is a strong evidence of unidimensionality (Byrne, 1994). The CFI indices for all the five service quality constructs presented in the developed instrument are shown in Table VII. All the CFI values are above 0.90, implying that there is strong evidence of unidimensionality for the scales.
Unidimensionality alone, although a prerequisite, is not sufficient per se to establish the usefulness of a scale. Once unidimensionality of a scale is established, its statistical reliability should be assessed before it is subjected to any further validation analysis (Ahire et al., 1996). Reliability of a measure is the ability to yield consistent results (Nunnally, 1988). Even a highly unidimensional scale would be of very little use if the resultant aggregate score is ascertained basically by measurement error, with the values of the scores broadly fluctuating over repeated measures (Gerbing and Anderson, 1988).
Measures of reliability
Several measures of reliability can be ascertained in order to establish the reliability of a measuring instrument. These include test-retest method, equivalent forms, split-halves method and internal consistency method. Of all the above methods, the internal consistency method requires only one administration and consequently is supposed to be the most effective, especially in field studies. Moreover, this method is considered to be the most general form of reliability estimation (Nunnally, 1988). In this method reliability is operationalized as internal consistency, which is the degree of intercorrelations among the items that constitute a scale (Nunnally, 1988). Internal consistency is estimated using a reliability coefficient called Cronbach's alpha (Cronbach, 1951). An alpha value of 0.60 and 0.70 or above is considered to be the criteria for demonstrating internal consistency of new scales and established scales respectively (Nunnally, 1988). The Cronbach's alpha values for all the five scales are shown in Table VII. All the values exceed the minimum requirements, thereby demonstrating that all the five scales are internally consistent and have acceptable reliability values in their original form.
Confusion
Confusion appears to prevail in the methodological literature with respect to the extensive variety of labels/tags and the way they are organized to describe the validity of scales and measures. Different validity terms are used to illustrate various aspects of construct validity. A comprehensive list of validity types that are typically mentioned in texts and research works includes face, content, convergent, discriminant and criterion-related validity.
Face validity. Face validity is the mere appearance that a measure is valid (Kaplan and Sacuzzo, 1993). In face validity one looks at the measure and see whether "on its face" it seems a good reflection of the construct. Although face validity is probably the weakest way of demonstrating the construct validity, it does not in any way mean it is wrong, as the researcher on most occasions relies on subjective judgement throughout the research process. As the service quality constructs are identified from the literature, their selection is justified, thereby ensuring the face validity of the instrument.
Content validity. Content validity is the degree to which the instrument provides an adequate representation of the conceptual domain that it is designed to cover. Apart from face validity, content validity is the only type of validity for which the evidence is subjective and logical rather than statistical (Kaplan and Sacuzzo, 1993). If the items representing the various constructs of an instrument are substantiated by a comprehensive review of the relevant literature, content validity can be ensured (Bohrnstedt, 1983). The present instrument has been developed based on a detailed analysis of the prescriptive, conceptual, practitioner and empirical literature. Moreover, the content validity of the instrument was also ensured through a thorough review by experts (both academia and practitioners) in the field.
Bentler Bonet coefficient
Convergent validity. Convergent validity refers to the degree to which the different approaches to construct measurement are similar to (converges on) other approaches that it theoretically should be similar to. When there is high correlation between a measure and other measures that are believed to measure the same construct, convergent evidence for validity is obtained (Kaplan and Sacuzzo, 1993). Convergent validity is based on the correlation between responses obtained by maximally different methods of measuring the same construct. Each item in a scale can also be treated as a different approach to measure the construct (Ahire et al., 1996). By this method the convergent validity can be established using a coefficient called Bentler Bonett coefficient (s). A scale with s values of 0.90 or above is an evidence of strong convergent validity (Bentler and Bonett, 1980). The values of s for all the scales are summarized in Table VII. All the scales have a s value of more than 0.90, thereby demonstrating strong convergent validity.
Uniqueness of the scale
Discriminant validity. Discriminant validity of a measure is the degree to which the measure is not similar to (or diverges from) other measures that it theoretically should not be similar to. Discriminant validity is ensured by showing that a measure does not correlate very highly with other measures from which it is supposed to differ, i.e. discriminant validity is an illustration of the uniqueness of the scale. Scales are tested for discriminant validity using a chi-square difference test. CFA is run for the selected pairs of scales, keeping the correlation between the two factors as free parameters. Let the chi-square value of this model be chi 1. In the next step CFA is re-run for the same scales by fixing the correlation between the two as 1. Let the chi-square value of the second model be chi 2. The chi-square difference test checks for the statistical significance of the statistic (i.e. chi 1-chi 2) at a significant level of 0.01. The two constructs of interest are distinct and hence unique if (chi 1-chi 2) is statistically significant. The above procedure should be repeated for all the possible pairs of scales in the instrument (Ahire et al., 1996). In the present study, as there are five service quality factors, a total 5C2, i.e. ten discriminant validity checks have been carried out. All the ten tests were statistically significant at the 0.01 level, thus indicating that all the 12 factors are distinct constructs - a strong demonstration of discriminant validity. As all the tests have been found to be statistically significant, the values of the ten chi-square differences are not furnished here.
Criterion-related validity. The basic idea of criterion-related validity is to check the performance of the measure against some criterion. In the present study criterion-related validity is established by correlating the scales scores with two criteria, viz. overall service quality (OSQ) and loyalty to the bank (L). The correlations are shown in Table VIII. It should be noted that all the scales have a significant positive correlations with OSQ and L. Thus criterion-related validity is established for all the scales.
Five factors
To sum up, all the five factors of customer-perceived service quality have shown strong evidence of unidimensionality, reliability, convergent, discriminant and criterion-related validities. Furthermore, the overall model CFI and the Bentler-Bonett coefficient (s) have exceeded the obligatory requirements. Therefore, it can be posited that customer perceptions of service quality can be considered as a five-factor structure consisting of the above identified five factors.
The standardized instrument can be used to measure the levels of customer perceived service quality. A service quality index (SQI) with respect to each factor can be computed for each organization. The SQI for a particular organization with respect to a particular factor is the average value (mean of the customers' scores) of that factor score per item. The SQI will give an indication of the service quality delivered by an organization (from the customers' viewpoint) with respect to a particular factor. The SQI values for all the factors will give an overall picture of the level of service quality delivered by an organization. Managers can keep these indices as a yardstick, on which improvement efforts can be focussed. These indices would also help researchers to better comprehend the different facets of customer-perceived service quality, especially in a developing economy. Researchers can use this work as a basis for subsequent studies in other service organizations (apart from banking) and in other economies. Such studies are vital to enrich the subject of customer-perceived service quality, as it would enable researchers and practitioners to thoroughly visualize the momentousness of the various aspects of service quality across multiple service settings and different cultures.
Although the underlying theme of the service quality instrument addresses the quality issues of the service sector as a whole, the study has been confined to the banking sector, due to time constraints and practical difficulties. The instrument has been validated by collecting data from customers of banks in a developing economy, i.e. India. Therefore, there is a possibility of a cultural bias playing a role in the outcome of the study as the expectations of people in a developing economy may be different from those of a developed economy.
Fastest growing sector
The service sector is probably the fastest growing sector of the economy today. A rapid acceleration of academic interest and subsequent research in services marketing has taken place in the past two decades. In other words, services marketing is triggering a lot of interest among researchers and managers in the sense that service providers are especially interested in how exactly to understand and measure customers' perceptions of service quality, what features of a service undermines its quality, and the possible impact of service quality on purchase predilections of the customers.
The present study strives to uncover the critical determinants of service quality that include those dimensions that are already addressed by the existing instruments and those that are overlooked in the literature, and subsequently proposes a conceptual model of service quality as perceived by customers. A comprehensive instrument framework with a specific focus on the banking sector has also been proposed and validated based on data collected from customers of banks in a huge developing economy. The limitations of the study and scope for further work have also been discussed. The instrument can be used by managers to measure the level of service quality delivered by them. The findings of the study could provide further insights for researchers in grasping the intrigues and intricacies of service quality and its determinants in the various service organizations.
Financial performance, costs, customer satisfaction and customer retention are all closely linked to service quality. Businesses around the world closely monitor what takes place at the forefront of service quality research, in the hope that it can give them the edge in the marketplace. But service quality is a rather abstruse and abstract concept that is difficult to define and measure.
The SERVQUAL instrument, devised by Parasuraman et al. in 1988, forms the cornerstone on which other works have been built. SERVQUAL is a 22-item scale that measures service quality along the dimensions of reliability, responsiveness, assurance, empathy and tangibles. SERVQUAL is operated by subtracting scores for customers' expectations of service quality from their perception scores with respect to the 22 items. While the original SERVQUAL instrument has been revised, refined and reformed, its basic content has remained unaltered.
Sureshchandar et al. believe that SERVQUAL focuses on:
Four of SERVQUAL's five dimensions - reliability, responsiveness, assurance and empathy - correspond to the human element in the service delivery, and only one to the tangibles. Moreover, Sureshchandar et al. contend that SERVQUAL does not address other important constituents of service quality: the service product or core service; systematization and standardization of service delivery; and the social responsibility of the service organization.
The core service is the essence of a service. The food a restaurant offers constitutes a service product. Even though the restaurant's staff may be friendly and courteous, customers will not attach a high value to the quality of service the restaurant provides if it fails to offer good quality and tasty food or a wide variety of recipes. An educational institution may have good infrastructure and other supporting facilities, but will not get a high rating in the academic world if it lacks well qualified and knowledgeable teachers who can impart quality education to their students.
Systematization of service delivery refers to the non-human element in the service delivery, in contrast to the human element, which has been effectively captured by SERVQUAL. Service delivery processes should be perfectly standardized, streamlined and simplified so that customers receive the service without hassles or hiccups. Improvements in information technology can play a crucial role in establishing seamlessness in service delivery.
Socially responsible companies encourage ethical behaviour in everything they do. A hospital that gives free treatment to the poor, an educational institution that grants scholarships to children from less affluent backgrounds, and a bank that provides loans on less rigid terms to the needy, are likely to be well regarded by all consumers. This will improve the organizations' image and influence customer perceptions of service quality.
Sureshchandar et al. develop a new model which they believe could improve understanding of the way in which customers perceive service quality. The model, developed in the financial services context, covers: core service or service product; human element of service delivery; systematization of service delivery (non-human element); tangibles of service; and social responsibility. It includes 41 items, tested in the context of the Indian banking industry. The authors believe that the model can be used to measure levels of customer perceived service quality, and provide managers with a yardstick on which improvement efforts can be focused.
(A précis of the article "Determinants of customer-perceived service quality: a confirmatory factor analysis approach". Supplied by Marketing Consultants for Emerald.)
Table I. The critical factors of customer-perceived service quality
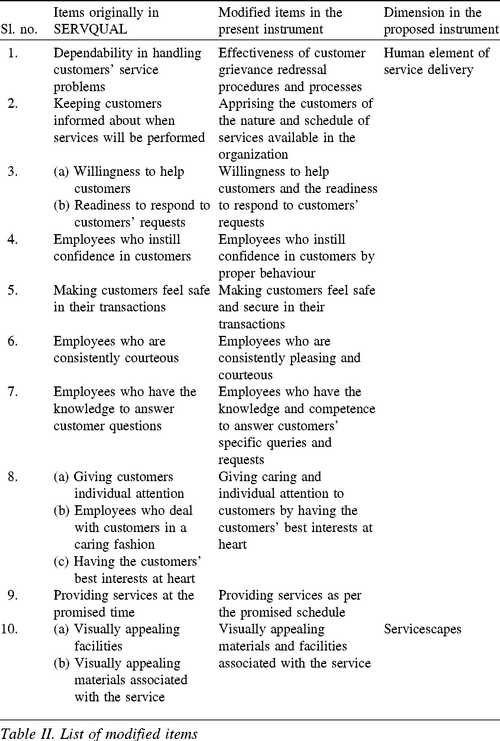
Table II. List of modified items
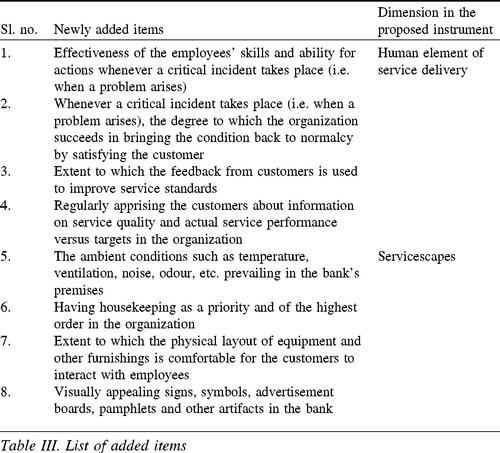
Table III. List of added items
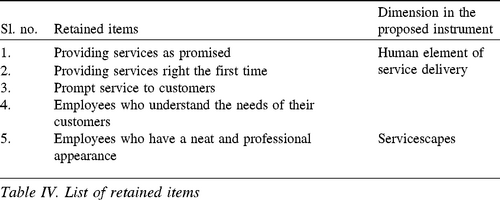
Table IV. List of retained items
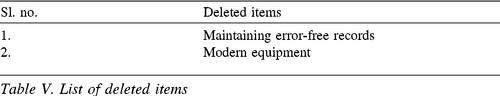
Table V. List of deleted items
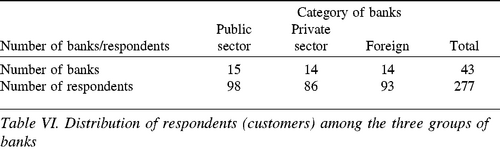
Table VI. Distribution of respondents (customers) among the three groups of banks
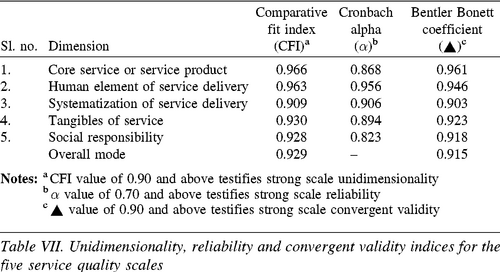
Table VII. Unidimensionality, reliability and convergent validity indices for the five service quality scales
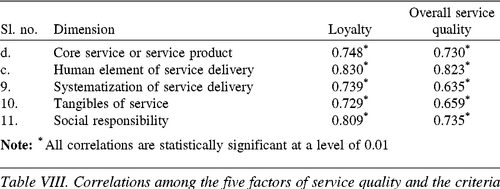
Table VIII. Correlations among the five factors of service quality and the criteria
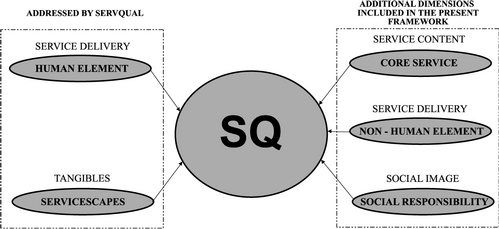
Figure 1. The critical factors of customer-perceived service qualitytci
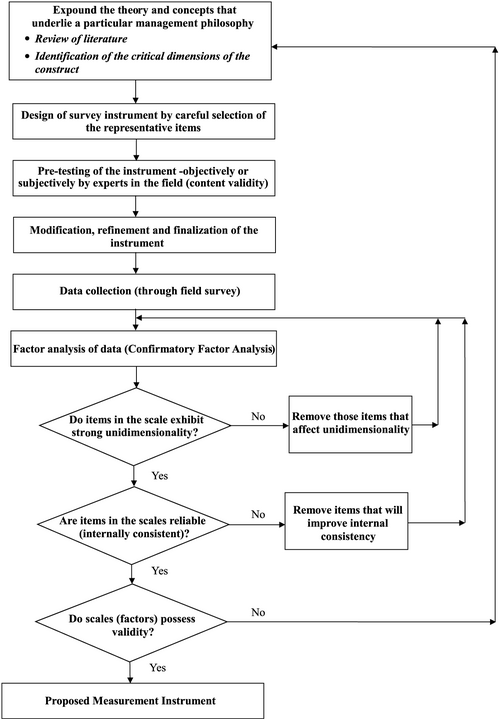
Figure 2. Development and validation of the measurement scaletci
Ahire, S.L., Golhar, D.Y., Waller, M.A., 1996, "Development and validation of TQM implementation constructs", Decision Sciences, 27, 23-56.
Ahire, S.L., Landeros, R., Golhar, D.Y., 1995, "Total quality management: a literature review and an agenda for future research", Production and Operations Management, 4, 277-306.
Anderson, J.C., Gerbing, D.W., 1991, "Predicting the performance of measures in a confirmatory factor analysis with a pretest assessment of their substantive validities", Journal of Applied Psychology, 76, 5, 732-40.
Anderson, T.D., 1992, "Another model of service quality: a model of causes and effects of service quality tested on a case within the restaurant industry", Kunst, P., Lemmink, J., Quality Management in Service, van Gorcum, Amsterdam, 41-58.
Angur, M.G., Nataraajan, R., Jahera, J.S., 1999, "Service quality in the banking industry: an assessment in a developing economy", International Journal of Bank Marketing, 17, 3, 116-23.
Babakus, E., Boller, G.W., 1992, "An empirical assessment of the SERVQUAL scale", Journal of Business Research, 24, 253-68.
Babakus, E., Inhofe, M., 1991, "The role of expectations and attribute importance in the measurement of service quality", Gilly, M.C.et al., Proceedings of the Summer Educators' Conference, American Marketing Association, Chicago, IL, 142-4.
Babakus, E., Mangold, W.G., 1992, "Adapting the SERVQUAL scale to hospital services: an empirical investigation", Health Services Research, 26, 2, 767-86.
Babakus, E., Pedrick, D.L., Inhofe, M., 1993, "Empirical examination of a direct measure of perceived service quality using SERVQUAL items", unpublished manuscript, Memphis State University, TN.
Baker, J., 1987, "The role of the environment in marketing services: the consumer perspective", Czepiel, J.A., Congram, C.A., Shanahan, J., The Service Challenge: Integrating for Competitive Advantage, American Marketing Association, Chicago, IL, 79-84.
Baker, J., Berry, L.L., Parasuraman, A., 1988, "The marketing impact of branch facility design", Journal of Retail Banking, 10, 2, 33-42.
Becker, F.D., 1981, Workspace, Praeger Publishers, New York, NY.
Bentler, P.M., 1995, EQS for Windows - User's Guide, Multivariate Software, Encino, CA.
Bentler, P.M., Bonett, D.G., 1980, "Significance tests and goodness of fit in the analysis of covariance structures", Psychological Bulletin, 88, 588-606.
Berry, L.L., Clark, T., 1986, "Four ways to make services more tangible", Business, 53-4.
Bitner, M.J., 1986, "Consumer responses to the physical environment in service settings", Venkatesan, M., Schmalensee, D.M., Marshall, C., Creativity in Services Marketing, American Marketing Association, Chicago, IL, 89-93.
Bitner, M.J., 1992, "Servicescapes: the impact of physical surroundings on customers and employees", Journal of Marketing, 56, 57-71.
Bitner, M.J., Booms, B.H., Tetreault, M.S., 1990, "The service encounter: diagnosing favourable and unfavourable incidents", Journal of Marketing, 54, 71-84.
Bohrnstedt, G., 1983, "Measurement", Rossi P., Wright J., Anderson A., A Hand Book of Survey Research, Academy Press, San Diego, CA.
Bolton, R.N., Drew, J.H., 1991, "A longitudinal analysis of the impact of service changes on customer attitudes", Journal of Marketing, 55, 1-9.
Bolton, R.N., Drew, J.H., 1991, "A multi stage model of customer's assessments of service quality and value", Journal of Consumer Research, 17, 375-84.
Booms, B.H., Bitner, M.J., 1982, "Marketing services by managing the environment", Cornell Hotel and Restaurant Administration Quarterly, 23, 35-9.
Boshoff, C., 1997, "An experimental study of service recovery options", International Journal of Service Industry Management, 8, 2, 110-30.
Boulding, W., Kalra, A., Staelin, R., Zeithaml, V.A., 1993, "A dynamic process model of service quality: from expectations to behavioural intentions", Journal of Marketing Research, 30, 7-27.
Bourman, M., van der Wiele, T., 1992, "Measuring service quality in the car service industry: building and testing an instrument", International Journal of Service Industry Management, 3, 4, 4-16.
Brown, T.J., Churchill, G.A., Peter, J.P., 1993, "Improving the measurement of service quality", Journal of Retailing, 69, 1, 127-39.
Buttle, F., 1996, "SERVQUAL: review, critique, research agenda", European Journal of Marketing, 30, 1, 8-32.
Byrne, B.M., 1994, Structural Equation Modelling with EQS and EQS/Windows - Basic Concepts, Applications and Programming, Sage Publications, Thousand Oaks, CA.
Carman, J.M., 1990, "Consumer perceptions of service quality: an assessment of the SERVQUAL dimensions", Journal of Retailing, 66, 33-55.
Clow, K.E., Vorhies, D.E., 1993, "Building a competitive advantage for service firms", Journal of Services Marketing, 7, 1, 22-3.
Cronbach, L.J., 1951, "Coefficient alpha and the internal structure of tests", Psychometrika, 16, 297-334.
Cronin, J.J., Taylor, S.A., 1992, "Measuring service quality: a re-examination and extension", Journal of Marketing, 56, 55-68.
Cronin, J.J., Taylor, S.A., 1994, "SERVPERF versus SERVQUAL: reconciling performance-based and perceptions-minus-expectations measurement of service quality", Journal of Marketing, 58, 125-31.
Davis, T.R.V., 1984, "The influence of the physical environment in offices", Academy of Management Review, 9, 271-83.
Finn, D.W., Lamb, C.W., 1991, "An evaluation of the SERVQUAL scales in a retail setting", Holman, R.H., Solomon, M.R., Advances in Consumer Research, Association for Consumer Research, Provo, UT, 18.
Ford, J.W., Joseph, M., Joseph, B., 1993, "Service quality in higher education: a comparison of universities in the United States and New Zealand using SERVQUAL", unpublished manuscript, Old Dominion University, Norfolk, VA.
Fort, M., 1993, "Customer defined attributes of service quality in the IBM mid-range computer software industry", unpublished MBA dissertation, Manchester Business School, Manchester.
Gagliano, K.B., Hathcote, J., 1994, "Customer expectations and perceptions of service quality in apparel retailing", Journal of Service Marketing, 8, 1, 60-9.
Gerbing, D.W., Anderson, J.C, 1988, "An updated paradigm for scale development incorporating unidimensionality and its assessment", Journal of Marketing Research, 25, 186-92.
Grönroos, C., 1993, "Toward a third phase in service quality research: challenges and future directions", Swartz, T.A., Bowen, D.E., Brown, S.W., Advances in Services Marketing, 2, JAI Press, Greenwich, CT, 49-64.
Hallowell, R., 1996, "The relationships of customer satisfaction, customer loyalty and profitability: an empirical study", International Journal of Service Industry Management, 7, 4, 27-42.
Harber, D., Burgess, K., Barclay, D., 1993, "Total quality management as a cultural intervention: an integrative review", International Journal of Quality and Reliability Management, 10, 17-27.
Harber, D., Burgess, K., Barclay, D., 1993, "Total quality management as a cultural intervention: an empirical study", International Journal of Quality and Reliability Management, 10, 28-46.
Hocutt, M.A., 1998, "Relationship dissolution model: antecedents of relationship commitment and the likelihood of dissolving a relationship", International Journal of Service Industry Management, 9, 2, 189-200.
Kaplan, R.M., Sacuzzo, D.P., 1993, Psychological Testing: Principles, Applications and Issues, 3rd ed., Brooks Cole, Pacific Grove, CA.
Keaveney, S.M., 1995, "Customer switching behaviour in service industries: an exploratory study", Journal of Marketing, 59, 71-82.
Kellogg, D.L., Youngdahl, W.E., Bowen, D.E., 1997, "On the relationship between customer participation and satisfaction: two frameworks", International Journal of Service Industry Management, 8, 3, 206-19.
Kotler, P., 1973, "Atmospherics as a marketing tool", Journal of Retailing, 49, 48-64.
Lewis, B.R., 1993, "Service quality measurement", Marketing Intelligence and Planning, 11, 4, 4-12.
Mangold, G.W., Babakus, E., 1991, "Service quality: the front-stage perspective vs the back-stage perspective", Journal of Services Marketing, 5, 4, 59-70.
Milakovich, E.M., 1995, Improving Service Quality, St Lucie Press, Delray Beach, FL.
Mills, P.K., Morris, J.H., 1986, "Clients as partial employees of service organizations: role development in client participation", Academy of Management Review, 11, 726-35.
Nelson, E., Rust, R.T., Zahorik, A.J., Rose, R.L., Siemanski, B.A., 1992, "Do patient perceptions of quality relate to hospital financial performance?", Journal of Health Care Marketing, 3, 4, 1-13.
Norman, R., 1991, Service Management, John Wiley & Sons, Chichester.
Nunnally, J.C., 1988, Psychometric Theory, McGraw-Hill Book Company, Englewood-Cliffs, NJ.
Oliver, R.L., 1993, "A conceptual model of service quality and service satisfaction: compatible goals, different concepts", Swartz, T.A., Bowen, D.E., Brown, S.W., Advances in Services Marketing and Management, 2, JAI Press, Greenwhich, CT, 65-85.
Parasuraman, A., Berry, L.L., Zeithaml, V.A., 1991, "Refinement and reassessment of the SERVQUAL scale", Journal of Retailing, 67, 420-50.
Parasuraman, A., Berry, L.L., Zeithaml, V.A., 1993, "More on improving service quality measurement", Journal of Retailing, 69, 140-7.
Parasuraman, A., Zeithaml, V.A., Berry, L.L., 1985, "A conceptual model of service quality and its implications for future research", Journal of Marketing, 49, 41-50.
Parasuraman, A., Zeithaml, V.A., Berry, L.L., 1988, "SERVQUAL: a multiple-item scale for measuring consumer perceptions of service quality", Journal of Retailing, 12-40.
Parasuraman, A., Zeithaml, V.A., Berry, L.L., 1994, "Reassessment of expectations as a comparison standard in measuring service quality: implications for further research", Journal of Marketing, 58, 111-24.
Parasuraman, A., Zeithaml, V.A., Berry, L.L., 1994, "Alternating scales for measuring service quality: a comparative assessment based on psychometric and diagnostic criteria", Journal of Retailing, 70, 3, 201-30.
Rapoport, A., 1982, The Meaning of the Built Environment, Sage Publications, Beverly Hills, CA.
Richard, M.D., Allaway, A.W., 1993, "Service quality attributes and choice behaviour", Journal of Service Marketing, 7, 1, 59-68.
Roest, H., Pieters, R., 1997, "The nomological net of perceived service quality", International Journal of Service Industry Management, 8, 4, 336-51.
Rust, R.T., Oliver, R.L., 1994, "Service quality: insights and managerial implications from the frontier", Rust, R.T., Oliver, R.L., Service Quality: New Directions in Theory and Practice, Sage Publications, London, 1-20.
Rust, R.T., Zahorik, A.J., 1993, "Customer satisfaction, customer retention and market share", Journal of Retailing, 69, 193-215.
Rust, R.T., Zahorik, A.J., Keiningham, T.L., 1994, Return on Quality (ROQ): Measuring the Financial Impacts of Your Company's Quest for Quality, Richard D. Irwin, Homewood, IL.
Rust, R.T., Keiningham, T.L., Clemens, S., Zahorik, A.J., 1999, "Return on quality at Chase Manhattan Bank", Interfaces, 62-72.
Rust, R.T., Zahorik, A.J., Keiningham, T.L., 1995, "Return on quality (ROQ): making service quality financially accountable", Journal of Marketing, 59, 2, 58-70.
Saleh, F., Ryan, C., 1992, "Analyzing service quality in the hospitality industry using the SERVQUAL model", Services Industries Journal, 11, 3, 324-43.
Schneider, B., Bowen, D.E., 1992, "Personnel/human resources management in the service sector", Research in Personnel and Human Resource Management, 10, 1-30.
Schneider, B., Bowen, D.E., 1993, "The service organization: human resources management is crucial", Organizational Dynamics, 21, 39-52.
Schneider, B., Bowen, D.E., 1995, Winning the Service Game, Harvard Business School Press, Boston, MA.
Schneider, B., Brief, A.P., Guzzo, R.A., 1996, "Creating a climate and culture for sustainable organizational change", Organizational Dynamics.
Schneider, B., Gunnarson, S.K., Niles-Jolly, K., 1994, "Creating the climate and culture of success", Organizational Dynamics.
Shemwell, D.J., Yavas, U., Bilgin, Z., 1998, "Customer-service provider relationships: an empirical test of a model of service quality, satisfaction and relationship oriented outcome", International Journal of Service Industry Management, 9, 2, 155-68.
Shostack, G.L., 1977, "Breaking free from product marketing", Journal of Marketing, 41, 73-80.
Soderlund, M., 1998, "Customer satisfaction and its consequences on customer behaviour revisited - the impact of different levels of satisfaction on word-of-mouth, feedback to the supplier and loyalty", International Journal of Service Industry Management, 9, 2, 169-88.
Spreng, R.A., Singh, A.K., 1993, "An empirical assessment of the SERVQUAL scale and the relationship between service quality and satisfaction", unpublished manuscript, Michigan State University, TN.
Stauss, B., Neuhaus, P., 1997, "The qualitative satisfaction model", International Journal of Service Industry Management, 8, 3, 236-49.
Stebbing, L., 1993, Quality Management in the Service Industry, Ellis Horwood, Chichester.
Steele, F., 1986, Making and Managing High-quality Workplaces, Teachers College Press, New York, NY.
Sundstrom, E., Altman, I., 1989, "Physical environments and work-group effectiveness", Research in Organizational Behaviour, 11, 175-209.
Teas, R.K., 1993, "Expectations, performance evaluation, and consumers' perceptions of quality", Journal of Marketing, 18-34.
Teas, K.R., 1993, "Customer expectations and the measurement of perceived service quality", Journal of Professional Services Marketing, 57, 4, 18-24.
Teas, R.K., 1994, "Expectations as a comparison standard in measuring service quality: an assessment of a reassessment", Journal of Marketing, 132-9.
Upah, G.D., Fulton, J.M., 1985, "Situation creation in services marketing", Czepiel, J., Solomon, M., Suprenant, C., The Service Encounter, Lexington Books, Lexington, MA, 255-64.
US Department of Commerce and Technology Administration, 1997, Malcolm Baldrige National Quality Award Guidelines, NIST, Washington, DC.
US Department of Commerce and Technology Administration, 1998, Malcolm Baldrige National Quality Award Guidelines, NIST, Washington, DC.
US Department of Commerce and Technology Administration, 1999, Malcolm Baldrige National Quality Award Guidelines, NIST, Washington, DC.
US Department of Commerce and Technology Administration, 2000, Malcolm Baldrige National Quality Award Guidelines, NIST, Washington, DC.
Venkatraman, N., 1989, "Strategic orientation of business enterprises: the construct, dimensionality and measurement", Management Science, 35, 8, 942-62.
Wineman, J.D., 1986, Behavioural Issues in Office Design, Van Nostrand Reinhold, New York, NY.
Wortruba, T.R., Tyagi, P.K., 1991, "Met expectations and turnover in direct selling", Journal of Marketing, 55, 24-35.
Zeithaml, V.A., Berry, L.L., Parasuraman, A., 1993, "The nature and determinants of customer expectations of service", Journal of the Academy of Marketing Science, 21, 1-12.
Zeithaml, V.A., Berry, L.L., Parasuraman, A., 1996, "The behavioural consequences of service quality", Journal of Marketing, 60, 31-46.
Zeithaml, V.A., Parasuraman, A., Berry, L.L., 1985, "Problems and strategies in services marketing", Journal of Marketing, 49, 33-46.
Zeithaml, V.A., Parasuraman, A., Berry, L.L., 1990, Delivering Quality Service: Balancing Customer Perceptions and Expectations, Free Press, New York, NY.
Zemke, R., Schaaf, D., 1990, The Service Edge, Penguin Books, New York, NY.
The instrument has asked for the respondents' perception of the actual level of service quality delivered by the banks with respect to the 41 items on a seven-point Likert scale where 1 = very poor, 2 = poor, 3 = slightly poor, 4 = average, 5 = slightly good, 6 = good, and 7 = very good.
The items have been jumbled and arranged in a random order in the original instrument. The items corresponding to the five factors of service quality are given below.
The following two items have been used to measure the criteria in order to ensure the criterion-related validity of the measurement instrument: